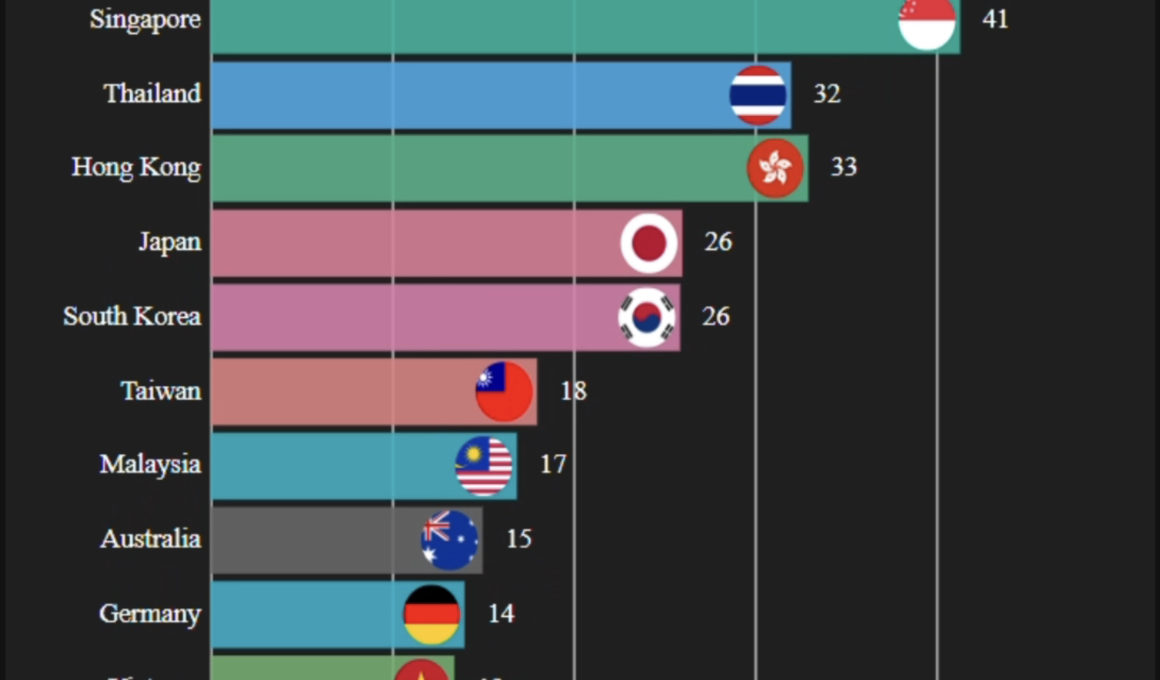
20 March 2020 DDashboard Visualize the COVID-19 outbreak for countries outside of Mainland China with a bar chart race byGoh Kok Han 178 shares 178 0 0 2 comments1 minute read Bar chart race is popular in social media, it helps you visualize the change of trend over time…
01 March 2020 DDashboard How to visualize your Linkedin Profile? byGoh Kok HanNo comments3 minute read Visualize your Linkedin Profile with Google Data Studio. Get FREE Template and STEPS BY STEPS tutorials on how to do it yourself NOW!
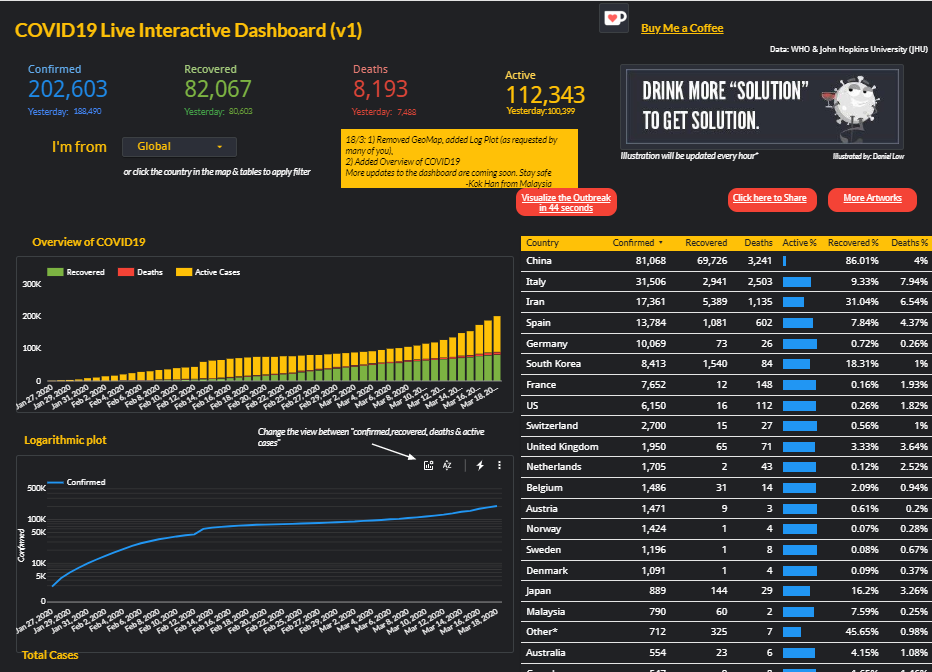
05 February 2020 DDashboard Coronavirus Interactive Dashboard (Mobile) byGoh Kok Han9 comments0 minute read
05 February 2020 DDashboard Coronavirus Interactive Dashboard (Tweaked) on Google Data Studio byGoh Kok Han 753 shares 752 0 1 29 comments1 minute read Click here for mobile version