


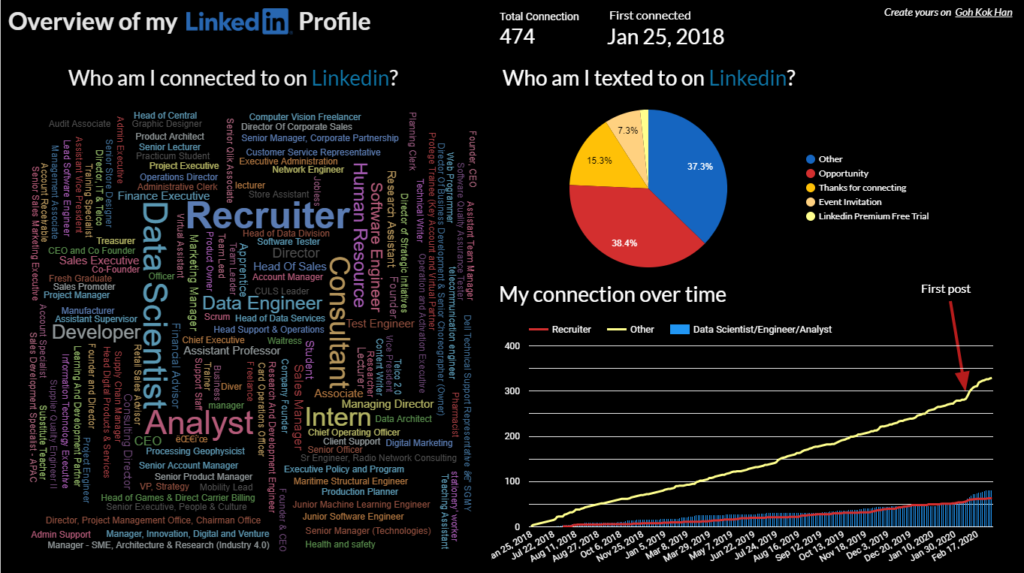
I always wonder how many of my Linkedin connections are data lovers like me?
No more procrastinating, yesterday I exported the data from Linkedin, and build a simple dashboard on Data Studio.
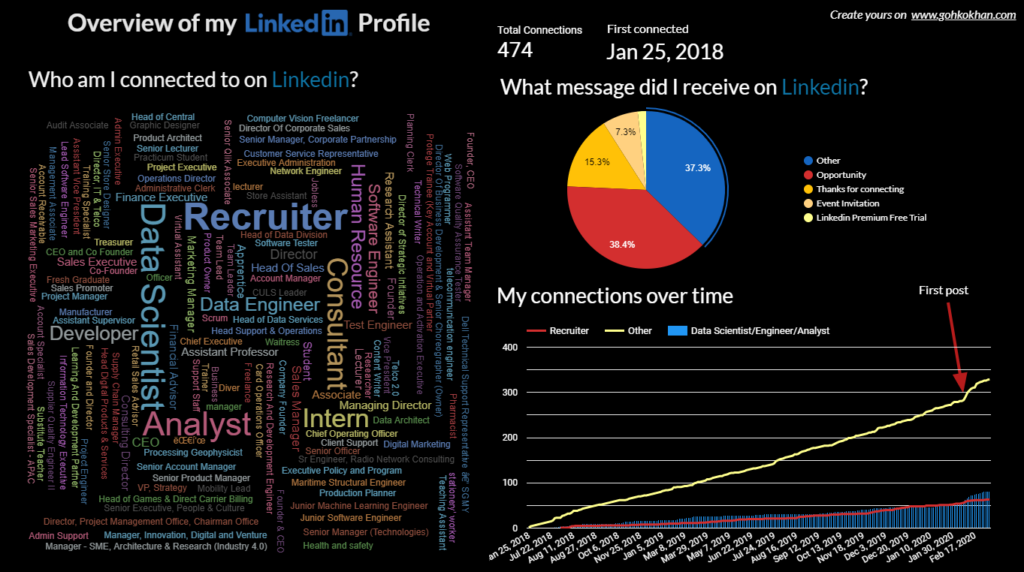
On the dashboard, I am surprised that many of my connections are coming from a Consultant background. Even though I am a Data Engineer, but there are more Data Scientists than Data Engineers on my Linkedin Connections. Being active on Linkedin gives me 3x more connections than usual.
How to create this simple dashboard?
The tool that I am using is the Google Data Studio. Data Studio turns your data into informative reports and dashboards that are easy to read, easy to share, and fully custom.
This tutorial is made for anyone, NO PRIOR VISUALIZATION EXPERIENCE IS NEEDED.
How to get the data from LinkedIn?
This is probably the first question that comes into mind for every data engineers.
Fortunately, Linkedin provides us an easier way to get our data.
Step 1
Login to Linkedin Export Page.
Step 2
Choose to Download larger data archive > Request archive

Step 3
Check your email and follow the instructions to download the data
Step 4
Extract the compressed file and what we need are the Connections and Messages files only. Feel free to look around what’s inside other files.

Step 5
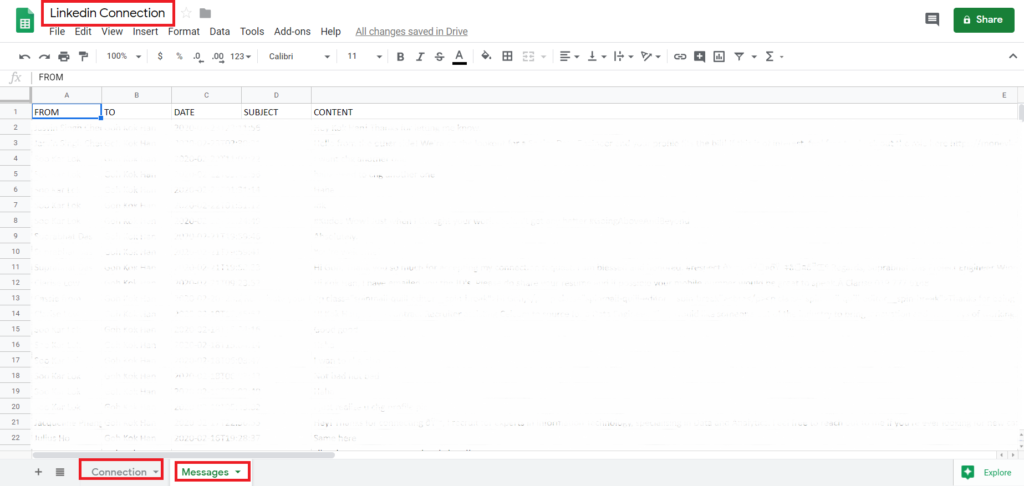
Create a Google sheets with the name Linkedin Connection, the first sheet is imported from the Connection, the second sheet is from the Messages. And you are ready to go!
Free Data Studio Template for Everyone!
Why build a dashboard yourself when you have a ready template? Get my FREE Data Studio template applied to your data real quick, Subscribe Now and get a link with STEP BY STEP Instructions in no time! NO CODING IS REQUIRED!
Want to do it yourself? No problem!
For those who want to dirty your hands in a little coding, let’s continue the journey!
- Create a Blank Report on Google Data Studio
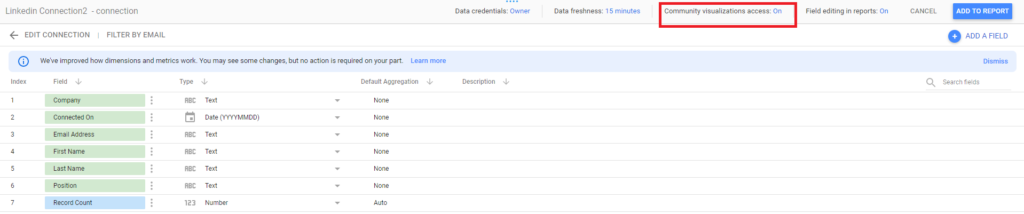
- At the right-hand side, Create New Data Source
- Select Google Sheets, choose the Sheets that we created just now. (You need to add the data source for both sheets separately. )
- Make sure you turn on Community Visualization Access
How to create a word cloud?
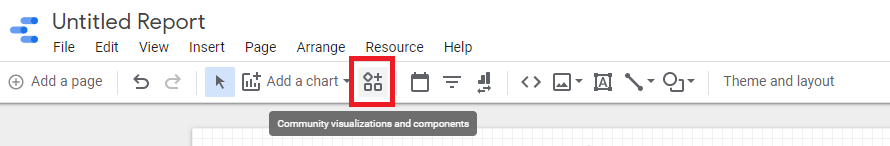
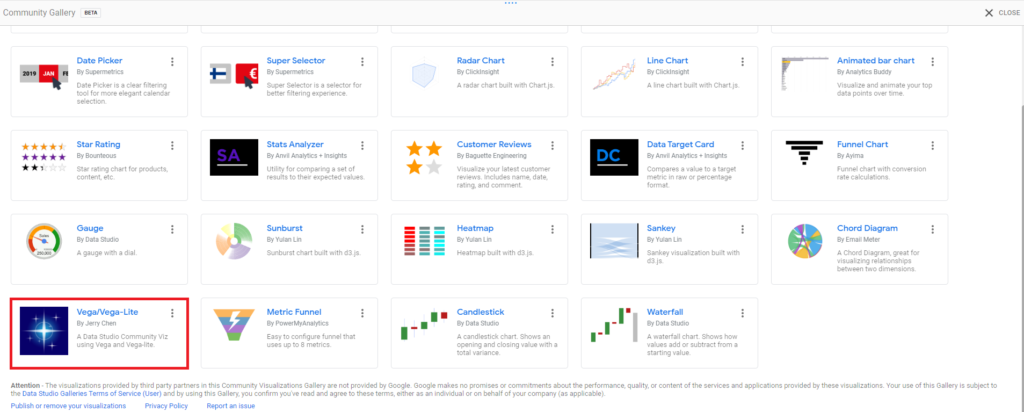
To create a word cloud, you need to select Community Visualization and Components
Select Vega/Vega-Lite by Jerry Chen
Configure the chart as below:
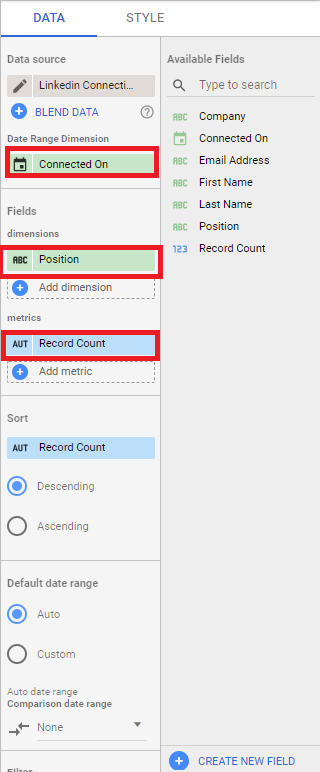
Here you successfully created a word cloud! *Claps*
However, if you notice… there are multiple positions that are the same. Principal Data Scientist, Lead Data Scientist, Senior Data Scientist are all data scientists.

How do we group all different titles of data scientist into one?
Using CASE statements & REGEXP_MATCH
CASE is useful to create new categories or groupings of data. You can learn more here.
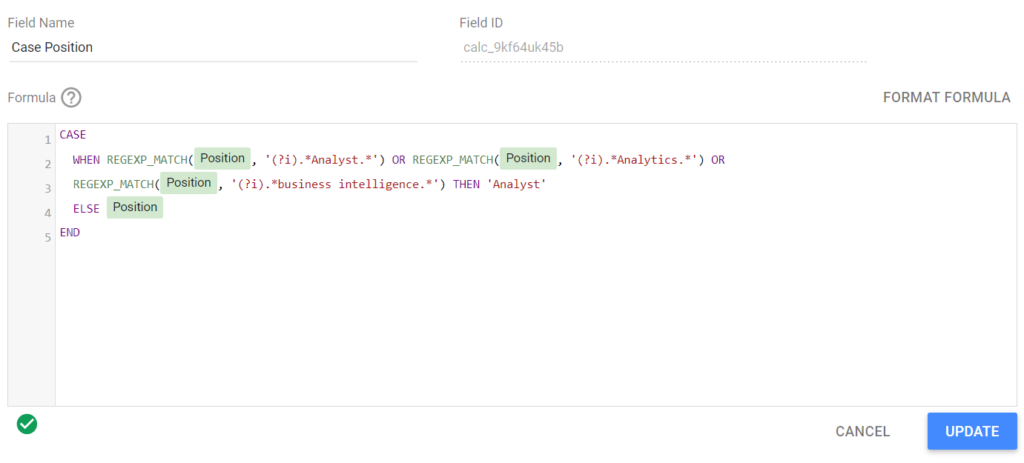
Create a New Field and paste the code below:
CASE
WHEN REGEXP_MATCH(Position,'(?i).*Analyst.*') or REGEXP_MATCH(Position,'(?i).*Analytics.*')
THEN 'Analyst'
ELSE Position
END
Replace the word Analyst, Analytics, business intelligence to any job positions that are related to your field.
How to create a pie chart?
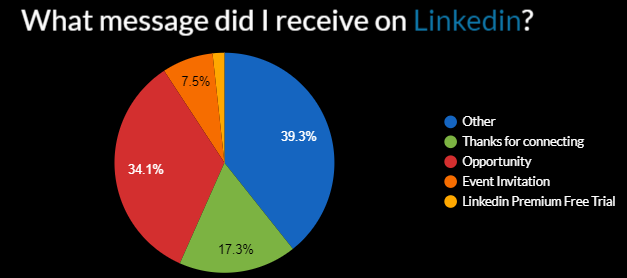
The same concept applied here, if you look at the Messages, the content field has the full conversation. We are going to group the message that contains the word “Opportunity, Opportunities, Hiring, etc.” together.
CASE
when REGEXP_MATCH(CONTENT,'(?i).*opportunit.*') or   REGEXP_MATCH(CONTENT,'(?i).*vacancy.*')  or REGEXP_MATCH(CONTENT,'(?i).*hiring.*') or REGEXP_MATCH(CONTENT,'(?i).*recruit.*') or  REGEXP_MATCH(CONTENT,'(?i).*acquisition.*') THEN 'Opportunity'
else 'Other'
END
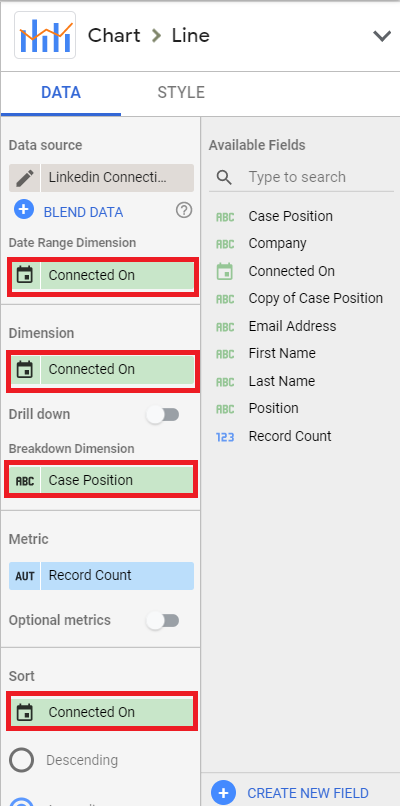
To create the time series line chart for connection over time
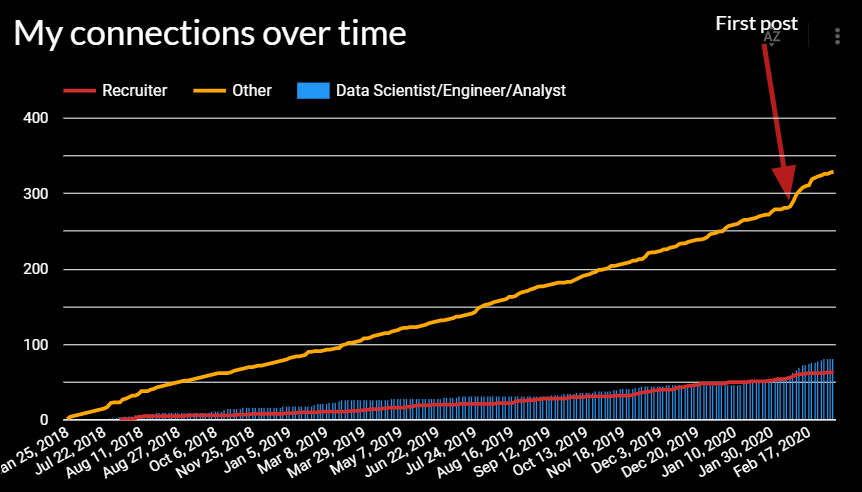
Just follow the configuration below:
Here you go! Add a title and a little creative to have your own customized dashboard for Linkedin Profile!
What is your Linkedin Profile look like? Share with me on Linkedin or Twitter!
Do you like my content?
gohkokhan.com is created by me during my free time, all the web hosting and app server are maintained by me.
to support my work, thank you for your support.Before you go, subscribe to the email updates below to get the latest articles straight into your mail!